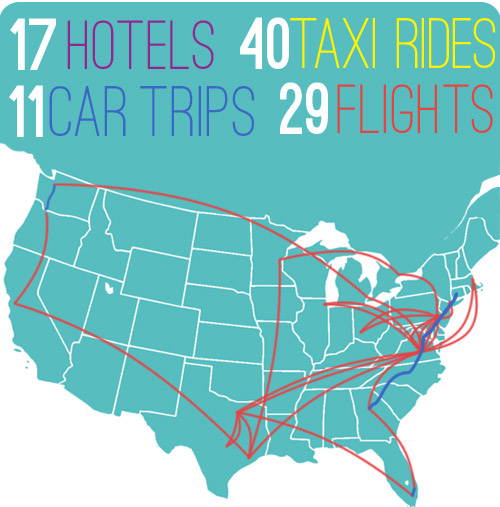
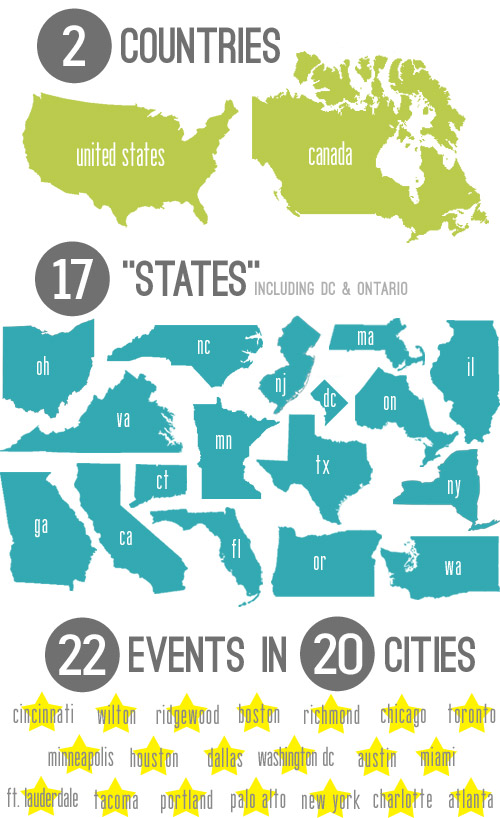
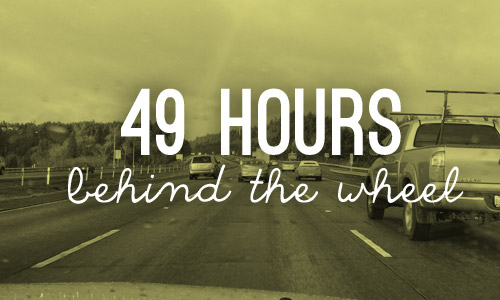
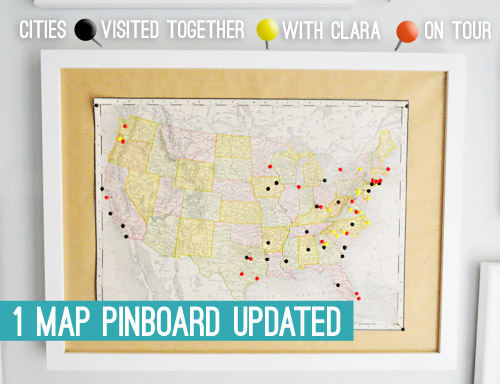
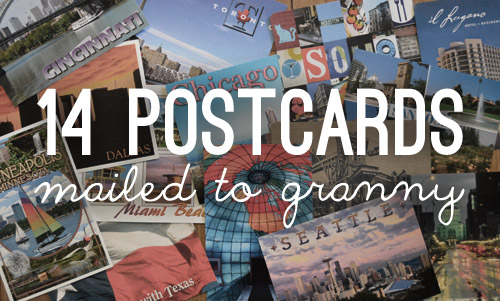
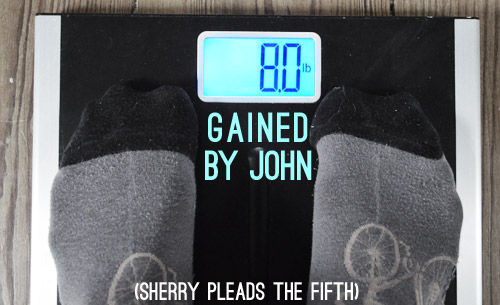
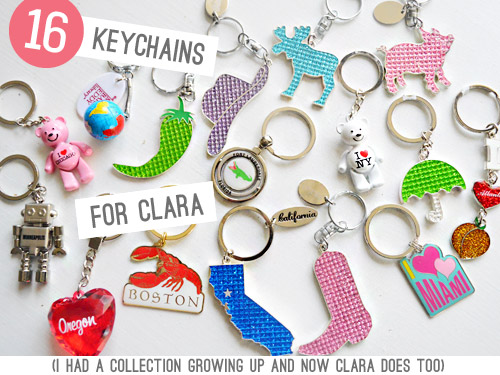
Back when we did this post full of fun charts and graphs (concocted from the results of our 2012 reader survey) we learned that you guys are just as into infographics as I am. So in that spirit, I tabulated and illustrated a bunch of random facts and figures that we never want to forget from our recent book tour. Sort of like an info-scrapbook that encapsulates that crazy time in our lives (in under 100 words) so we can always look back on it. So without further ado, here are all the places we went, the adventures we had, and even the pounds that we put on along the way. Enjoy!


* Each of the infograhics above were made in photoshop and the fonts that we used are: Ostrich Sans (free) , Fyra (free), and The Only Exception (we donated).
Oh but one thing that we couldn’t quantify or illustrate was how many fun, kind, and wonderful people we met along the way. We can’t say thank you enough to everyone who took time out of their busy lives to come welcome us to their city. It really means a lot. You made this whole wacky adventure (and all of those hours spent sitting in cars, taxis, and planes) completely worth it and then some.
How do you guys travel? Do you keep track of any stats, like a count of how many countries or states you’ve visited? My mom has a goal of seeing every state capitol in the US (I think she’s over 70% there). What’s the longest flight you’ve ever enjoyed / suffered through? Ever wear the same Target blazer to 22 events? I know some people wouldn’t brag about that, but as a husband I can’t tell you how much I love my lady for it.
Psst- We picked this week’s giveaway winners. Click here to see if you’re one of them.

Leave a Reply